


Pmaps DRC Documentation
Table of contents
This pages are the manual of this application.
About PmapsDRC
The application retrieves GIS data from geoserver and renders it on maps in an end user friendly manner. Further the user can collect data connected to GIS objects registered in geoserver before.
The collected data can also be statistically analysed and visualised. Certain data can spark alarms for GIS objects. As of now the staff can collect water quality data, register it in the applications database and view statistics.
Getting started:short Howtoes for the user
How to create a new Town entry
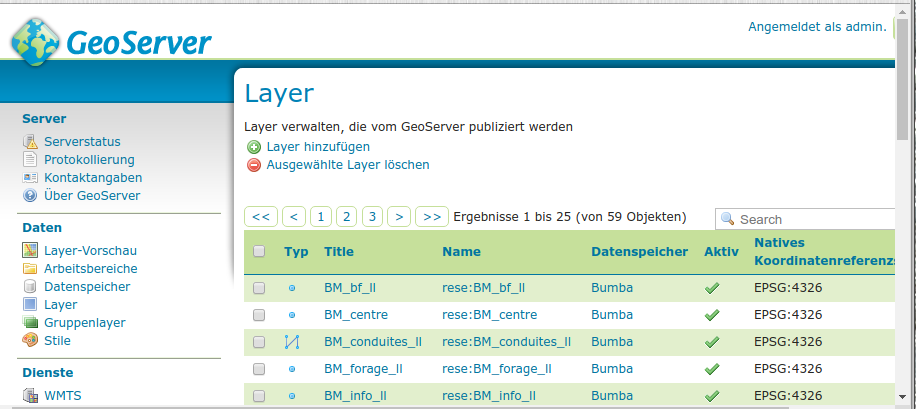
The application automatically scans the workspace by the name of rese everytime the main map page is loaded. All data stores in that workspace are printed on the page as links showing the name of the store. Thus: if you create a new store in rese by the name of "newTown" the main map page will show that store under that name at the next visit to the main map page.
So, to create such a new entry, log in to geoserver, navigate to the rese workspace an create a new store:
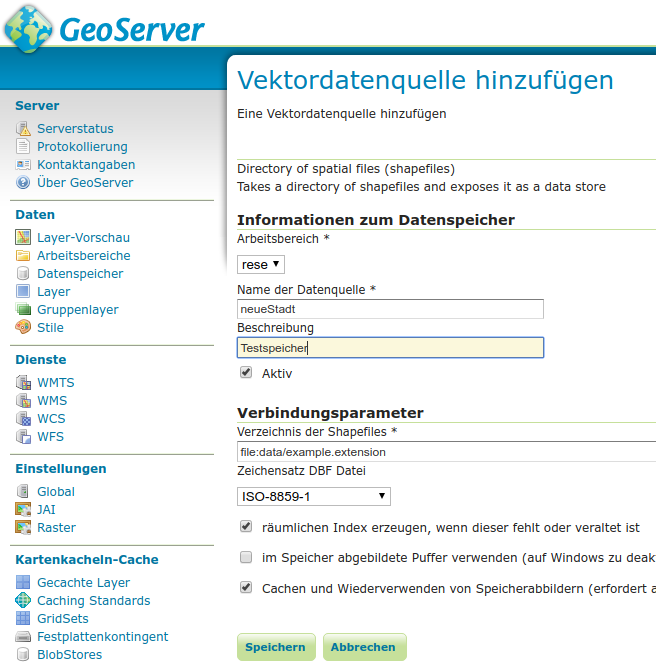
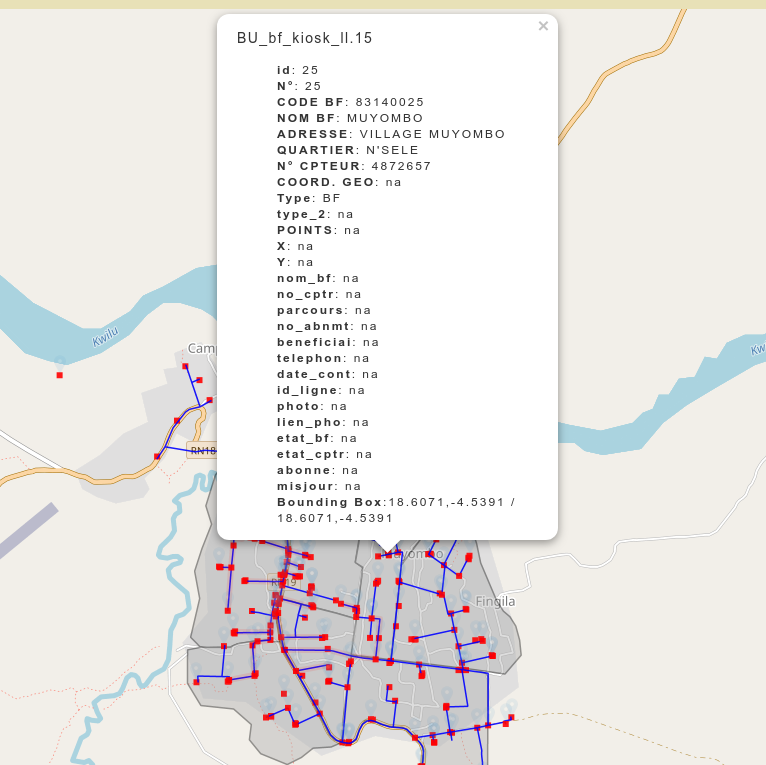
The application will scan every shapefile in that store as the user clicks this link and render the layers in the map. It will also retrieve additional informations in the individual datasets in the shapefile, extract their GEOM and create a Java Script object for Leaflet, that can be clicked by the visitor to show these additional infos in a flyout bubble immediately at click and more detailed infos on a overlay page at click on "view details" in that bubble.
Editing and updating GIS data
The actual code in the map application consists of both the layer itself as loaded from geoserver plus Java Script code, that shows leaflet objects. Nevertheless the main map shows the GIS data from geoserver excluselively. Changes and additions may be done in the shapefiles registered in geoserver. If you use an editor such as QGIS, you may update the data on the fly, while you edit it by exporting your work to geoserver.
Such changes will be visible on the map as soon as the visitor reloads the map page in the web browser. Please be aware, that geoserver uses a caching system by default. It may happen, that modifications ware not visible immediately at reload, because the WMS call does not get the actual GIS data but the tiles rendered some time before your modifications into the tile cache. Clearing the tile cache in geoserver is a radical but sure measure to avoid that effect. But also some web browsers may keep already rendered tiles in their cache and fail to upgrade after a modification, so clearing the browser cache when testing before clearing the tile cache in geoserver may be a cleaner solution.
Collecting water quality data
Measurement series have to be collected for sample points, that are connected to GIS objects. If a samplepoint is needed in a place, that is not registered in geoserver already, you need to add that point to geoservers GIS data before you can create that sample point.
When you click "Register new point" in the Water quality section the map opens and you may select a Town as usual and a GIS Object on that map.
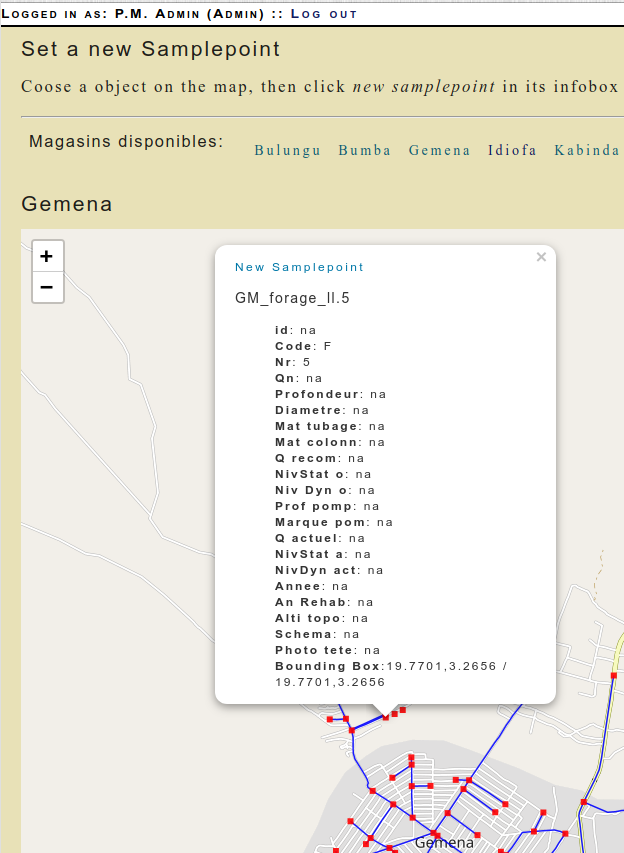
At click on the desired Object the flyout bubble shows the usual list of features and atop the bubble you see the "New Samplepoint" button. A click on that button opens the form to create a new samplepoint. All the relevant GIS data is already set in that form readonly. The new samplepoint will be bound to the featureID of the GIS object, in the case shown above, that would be "GM_forage_ll.5".
Please be aware, that the samplepoint will follow all changes of the GIS object, that may or may not be made. Thus, if the staff finds out, that a water kiosk was not registered with correct coordinates and changes the GEOM in geoserver, your samplepoint will follow that changes also.
As a samplepoint is set, you find it in the Samplepoints table. theis table offers several options to work with the data, for now you can view the points position and details on the map and you can register new measurments for that point.
Types of measurements
Measurments can be of differnt complexity. You may want to do a full list of tests as a baseline for a samplepoint and later on you may want to test only the most volatile and/or important values every week and specialised tests for metallic contamination occasionally or when explicitly needed only.
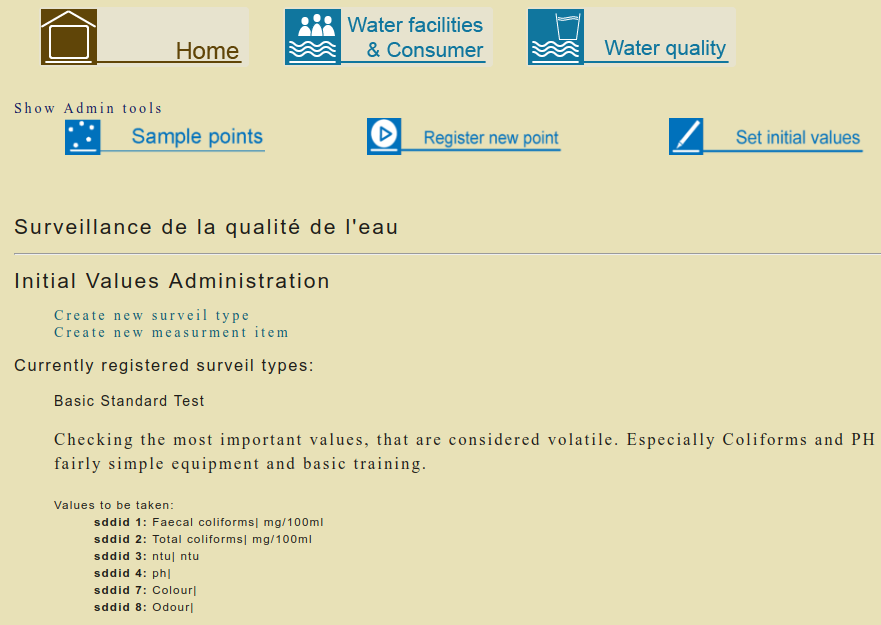
The application offers to create such test checklists by putting together previously registered value types. The "Set initial values" in the Water Quality section shows an overview of already registered measurment sets and offers to create a new surveil type and new measurment items:
Background Informations
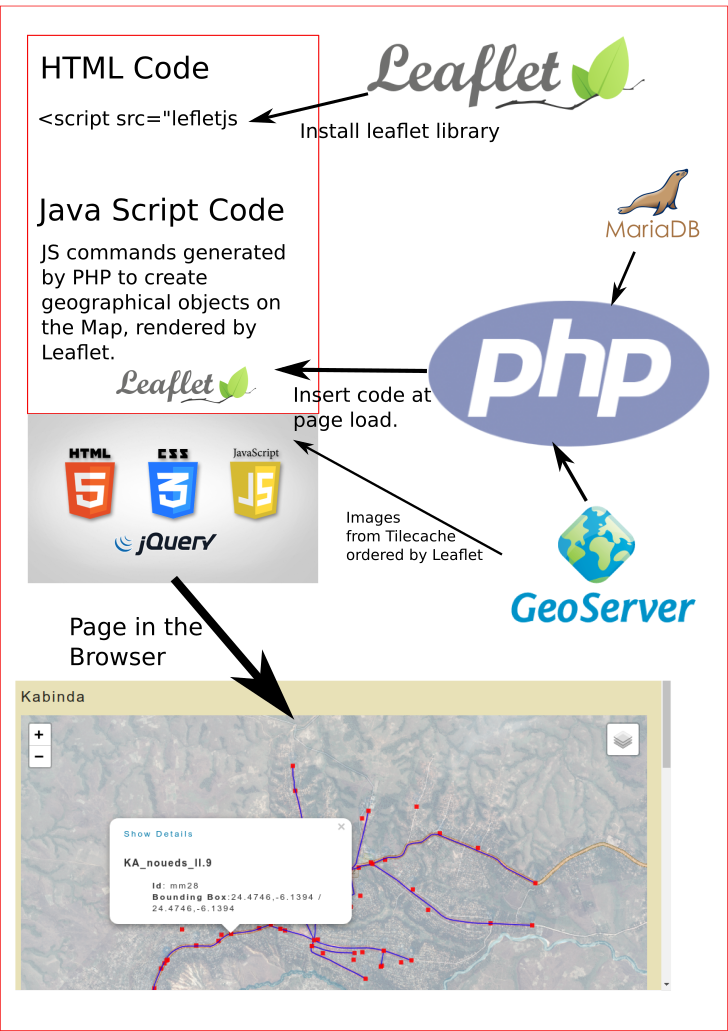
How the application transforms geoserver stores to individual leaflet maps
Geoserver offers several ways to retrieve data from its data stores.
The Application uses the REST API, the WMS(Web Map Service) and the WFS(Web Feature Service) from Geoserver to get the data, that shal be displayed in the applications web frontend.
An example, getting the list of stores:
$workspace_name="rese";
$pm_stores=pm_get_gis_stores($workspace_name);
As you can see, the rese workspace is set by default, the application will get any store from it and it will(for now) ignore all data in other workspaces.
The function pm_get_gis_stores is written in PHP to simplify the job here, it gets the info from geoserver like this:
function pm_get_gis_stores($workspace_name){

 $stores=pm_get_json("http://ungeo.de:8080/geoserver/rest/workspaces/$workspace_name/datastores.json");

 return $stores;
}
It calls geoservers REST API asking for the store names in workspace rese in JSON format. This is a structured pure text format, similar to XML or HTML, but with a narrower scope and thus easier to parse.
As you may have noticed, the URL, that calls the REST API, is passed to another PHP function by the name of pm_get_json, that is also written for the application (that is the reason for the "pm" prefix of the functions name). Let us have a look at this function too:
function pm_get_json($url){

  // create curl resource
 $pm_grabber = curl_init();
 // set url
 curl_setopt($pm_grabber, CURLOPT_URL, "$url");
 $passwordStr = "admin:XXXXPasswordXXX";
 curl_setopt($pm_grabber, CURLOPT_USERPWD, $passwordStr);
 //return the transfer as a string
 curl_setopt($pm_grabber, CURLOPT_RETURNTRANSFER, 1);

 // $output contains the output string
 $pm_info = curl_exec($pm_grabber);
 $pm_info=json_decode($pm_info,'assoc');

 return $pm_info;

}
The function uses CURL, a kind of a non interactive, programmable webbrowser, to send the URL to Geoserver. CURL gets the result and it is passed to the function json_decode, that is an onboard function, that comes with PHP7. It transforms the structure of the JSON stream into an array, similar to the arrays, that come frome database queries and the like.
Tipp: try to put the very same URL in your webbrowsers adress line while you are logged in in geoserver at ungeo...
In short: now we have the list of stores as if we would have grabbed them from a SQL Database.
Next example: how we use the storenames to configure a leaflet map for a store
The Storenames are formatted as HTML links, listed above the main map.
At click on one of them the page reloads and the store name can server as the key to find the appropriate informations in geoserver.
First we need the names of the layers in the store:
$pm_layer_names=pm_get_gis_featuretypes($pm_store_name);
That is quite similar to the code, that gets the list of stores, it takes the clicked storename via the standard HTTP $_GET array from the URL and asks geoserver for layers in that store.
 foreach($pm_layer_names['featureTypes']['featureType']as $layer_name){

  $pm_gis_layers[]=$layer_name['name'];
 }
A PHP foreach loop writes every layer name to another list, stored in the PHP variable pm_gis_layers, that is in the structured array format as well. As this is done, another foreach loop iterates thru the names and feeds them to another pm function:
$pm_gis_layers_features[$i]=pm_get_gis_features($layer_name);
The function pm_get_gis_features does quite the same as the abovementioned function, that catches the storenames, it uses CURL to get the detailed infos stored for each layer in the respective shapefiles. Let us only have a look upon the URL it uses, for it is our first example for a call to geoservers WFS:
 // set url
 curl_setopt($pm_feature_grabber, CURLOPT_URL,
"http://localhost:8080/geoserver/rese/ows?
service=WFS&version=1.0.0&request=GetFeature&typeName=$layer_name&maxFeatures=50&outputFormat=application%2Fjson");
As the call is executed, the variable $layer_name ist evaluated and thus becomes a layer name such as BM_noeuds_ll, this layer contains datasets for individual features such as BM_noeuds_ll.2,BM_noeuds_ll.3 and so forth...
We will later use that individual sets to configure single points and vectors with flyout bubble at click in leaflet. But first we need to ask leaflet to render the complete layer on the map:
Leaflet is, as usual, object oriented Java Script. It does not need any additional libs and renders to a simple HTML div container, that can be formatted and designed as any other div in HTML using CSS.
The Java Script code to draw the layer from geoservers Tilecache to the map is quite straight forward as well:
   var ReseWms = L.tileLayer.wms('http://ungeo.de:8080/geoserver/rese/wms?', {
      layers: 'BM_noeuds_ll',
      opacity: 0.9,
      format: 'image/png',
      transparent: true
    }).addTo(pmMap);
The variable pmMap holds the map object, that we have created before using leaflets new L.Map call. Leaflet can read WMS directly to draw tiles on its map at correct positions, zoomable etc. But WMS is not implemented completely in leaflet, you cannot get capabilities and other special infos via a WMS call with leaflet. This is deliberate and its a good thing: it keeps leaflet lean and robust.
Anyway: to get the details from the shapefiles for every object on the map, we need to grab them from geoserver. PHP plus CURL can do that, as you already may have guessed...
Again we use WFS to grab the features of every data set:
 curl_setopt($pm_feature_grabber, CURLOPT_URL,
"http://localhost:8080/geoserver/rese/wfs?
&version=1.1.0&request=GetFeature&outputFormat=JSON&typename=rese:$typename[0]&featureid=$feature_id");
Of course you have noticed, that this is quite similar to the call from above, in which we have captured all the layers in a store, whose name is for no particular reason in a variable named $typename[0]. After that you see the WFS query featureid, this would be something like BM_noeuds_ll.3 holding the individual data of set number 3 in the layer BM_noeuds_ll...
The result holds all the data including the geom for that particular object. We use this to create a clickable leaflet object on the map and show all the rest in a popup, like this:
    var latLonExtra12=["coordinates extracted from featureid"];

    marker12 = L.marker(latLonExtra12, {icon: smallIcon}).addTo(pmMap);
    marker12.bindPopup
('All the extracted data formatted as HTML, too complicated to be shown as such in this tutorial...');

    marker12.on('click', function () {
    marker12.openPopup
    });
Please be aware, that this is not the actual code, the number 12, the coordinates and the content for the popup are inserted with PHP, that would crash the HTML of this tutorial...
Here we go: we have the tiles for all layers of a store and for every single object in these tile layers we have clickable leaflet objects. The rest is fun stuff ;-)
How the System is build
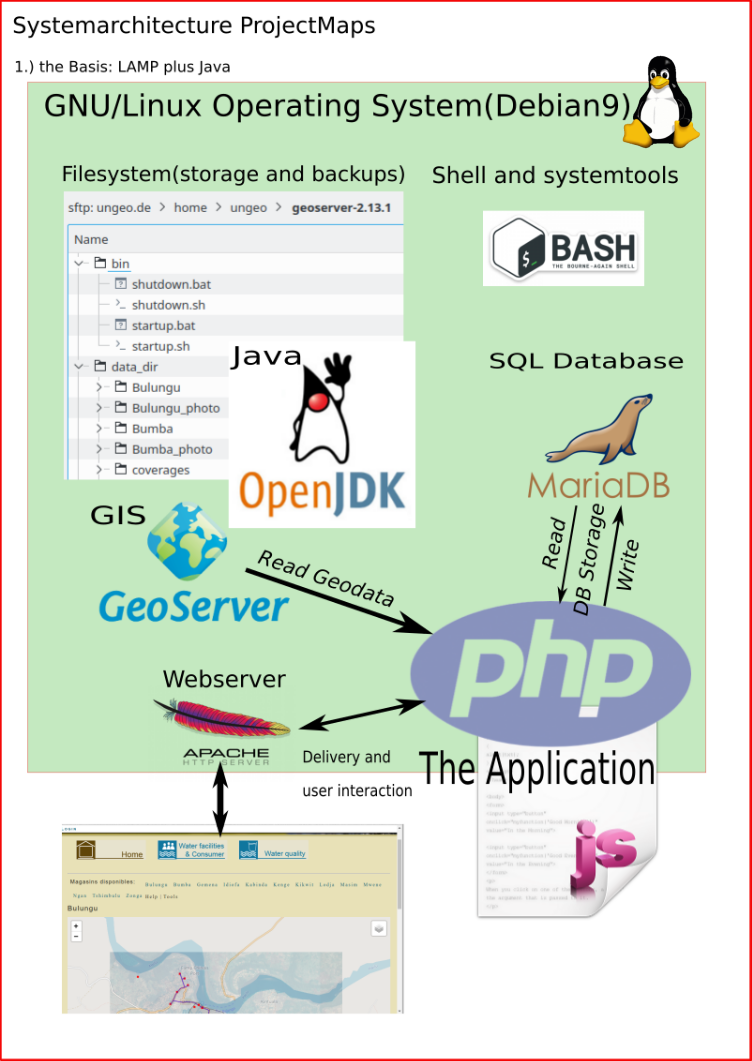
The Application is written in the Programming languages PHP and Java Script. PHP runs on the Server and retrieves Data from Geoserver(that runs with the Java Programming language) and it stores and reads data from an SQL Database, implemented as the Maria DB RDBMS.
The user gets data and interacts with the application via the webserver software Apache running on the server. The Java Script code is sent to the user and runs in the users webbrowser to allow direct interaction without reloading data from the server while zooming into the map, configuring forms and several other actions, that would gravely suffer from the need for reloads.
The user accesses the application in his or her webbrowser via a http connection as known from any other website. The user can access the application via a Local Area Network(LAN) as known from any generic home router, via the Internet or, if needed in a webbrowser running on the server itself(Firefox is installed on the machine and can be used via the Cinnamon Desktop environment).
The application should work without any problems on any modern Webbrowser, be it on a PC running Linux, Windows or MacOSX or on a mobile device. In the latter case everything will work given the display is big enough to show the complete user interface. Any modern Mobile Phone with a screen resolution width of 1024px or better will do, so will all tablets.
Currently the application ist tested in the webbrowsers Google Chrome and Mozilla Firefox. It should run on all other browsers as well but your mileage may vary...
The Brix Appliance is running the needed components(Java, Geoserver, Apache, Maria DB and PHP) on a GnuLinux Operationg System (Debian 9). Debian offers a unparalleled stable and trustworthy basis for webapplications, it is used by thousands of top notch commercial, industrial and scientific applications around the world and has proven its qualities since about 20 years now. It also comes with a package management that allows system updates without any interruption of productive work and even upgrades to newer generations of the Operating System whithout the need to reinstall applications.
But the most important feature of Debian is its license: it is free software. That means of course, that it comes free of charge regardless, how many instances you install. But much more important it means, that there are absolutely no restrictions on the usage and configuration of the system.
In order to get a recent version of Geoserver we install it as a Java Binary in the users HOME folder, which is best for us in order to have maximum flexibility when working with the GIS data but it is not the standard method to install software in Linux. Still we can use it that way and Debian allows us to even configure our Geoserver as a system service.
Another crucial feature of the Debian system is its advanced system shell BASH, that allows remote operation via a SSH connection made by internet and a programming language, that we use to write maintainance scripts and elaborate backup automatisms with.
The Installation process
As mentioned before the underlaying operating system offers a package management, that allows to install and set up the most important components easily. Since we need some more flexibility regarding Geoserver, we will not use that management system for our GIS component.
Step one: OS Installation and setup
We use the stable branch of Debian 9 and install it with the minimal desktop system Cinnamon. The latter is somewhat unusual for server appliances. We made the decision, that the seldomly used desktop components can come in handy whenever we need to access the application directly on the machine, whithout using any local network or internet.
The Brix may be connected to a monitor and keyboard/mouse to log in in that direct way, username and password are provided, when such access is neccessary.
The system is installed and set up in a way, that normal operation does not demands such access. The system is set with the hostname ungeoTownname.pm. "Townname" would be the name of the town, where the appliance is used, so an Appliance for Bulungu would have the hostname ungeoBulungu.pm.
The following server components are set up and running by default:
- SSH (for remote operation via internet or local net at port 22, provides secure filetransfer via SFTP also)
- HTTPD (the webserver Apache listening at port 80)
- MariaDB (internal SQL database RDBMS for use with the Application)
- PostGreSQL (internal SQL database RDBMS for use with Geoserver only)
- PHP 7 module for Apache including several extensions
Step two: Geoserver Installation
As mentioned above we install Geoserver from the Platform Independent Binary Package available on the projects website at geoserver.org
The package is extracted and configured in the filesystem at path adress /home/ungeo/geoserver "ungeo" is the default username for the system, it is also used for login to the system via network(ssh protocol).
Further geoserver is set up as a system service using the systemctl command used by Debian and all modern Linux distributions to manage and control system services.
The Platform Independent Binary Package comes with the Java based webserver component Jetty, please be aware, that the Tomcat Applet Server, that is used by many other installation methods of Geoserver is not used and should not be installed in order to avoid conflicts. As the geoserver service is started, Jetty offers connection to it at port 8080, like so: http://ungeoTownname.pm:8080/geoserver.
Geoserver running at http://ungeoTownname.pm:8080/geoserver
Step three: Installation of the Application
ProjectMaps is a PHP based webapplication, it is installed as a range of plain folders and files into a place accessible by the apache webserver. That is in our case /home/ungeo/pm. This adress is set up in Apaches configuration files as the default website to be delivered, if any client asks for a connection to port 80.
The Leaflet map software is integrated in the Application, stored in subfolders of /home/ungeo/pm/addons/js and called as needed in the header of the HTML page, that the PHP system delivers at users request. The leaflet software is downloaded to the users computer and executed in his or her browsers context. Given, that the Appliance is connected via a fast connection in a local network, this process does not take a full second of time. Even with a moderately fast LTS wireless connection a page like the Bulungu map with more than 3400 lines of code (90% of it Java Script) loads and renders in less than 2 seconds, and it gets even faster as the browser caches the Java Script libraries, CSS and images and thus does not need to download these after the first visit anymore.
How we draw the map with Leaflet